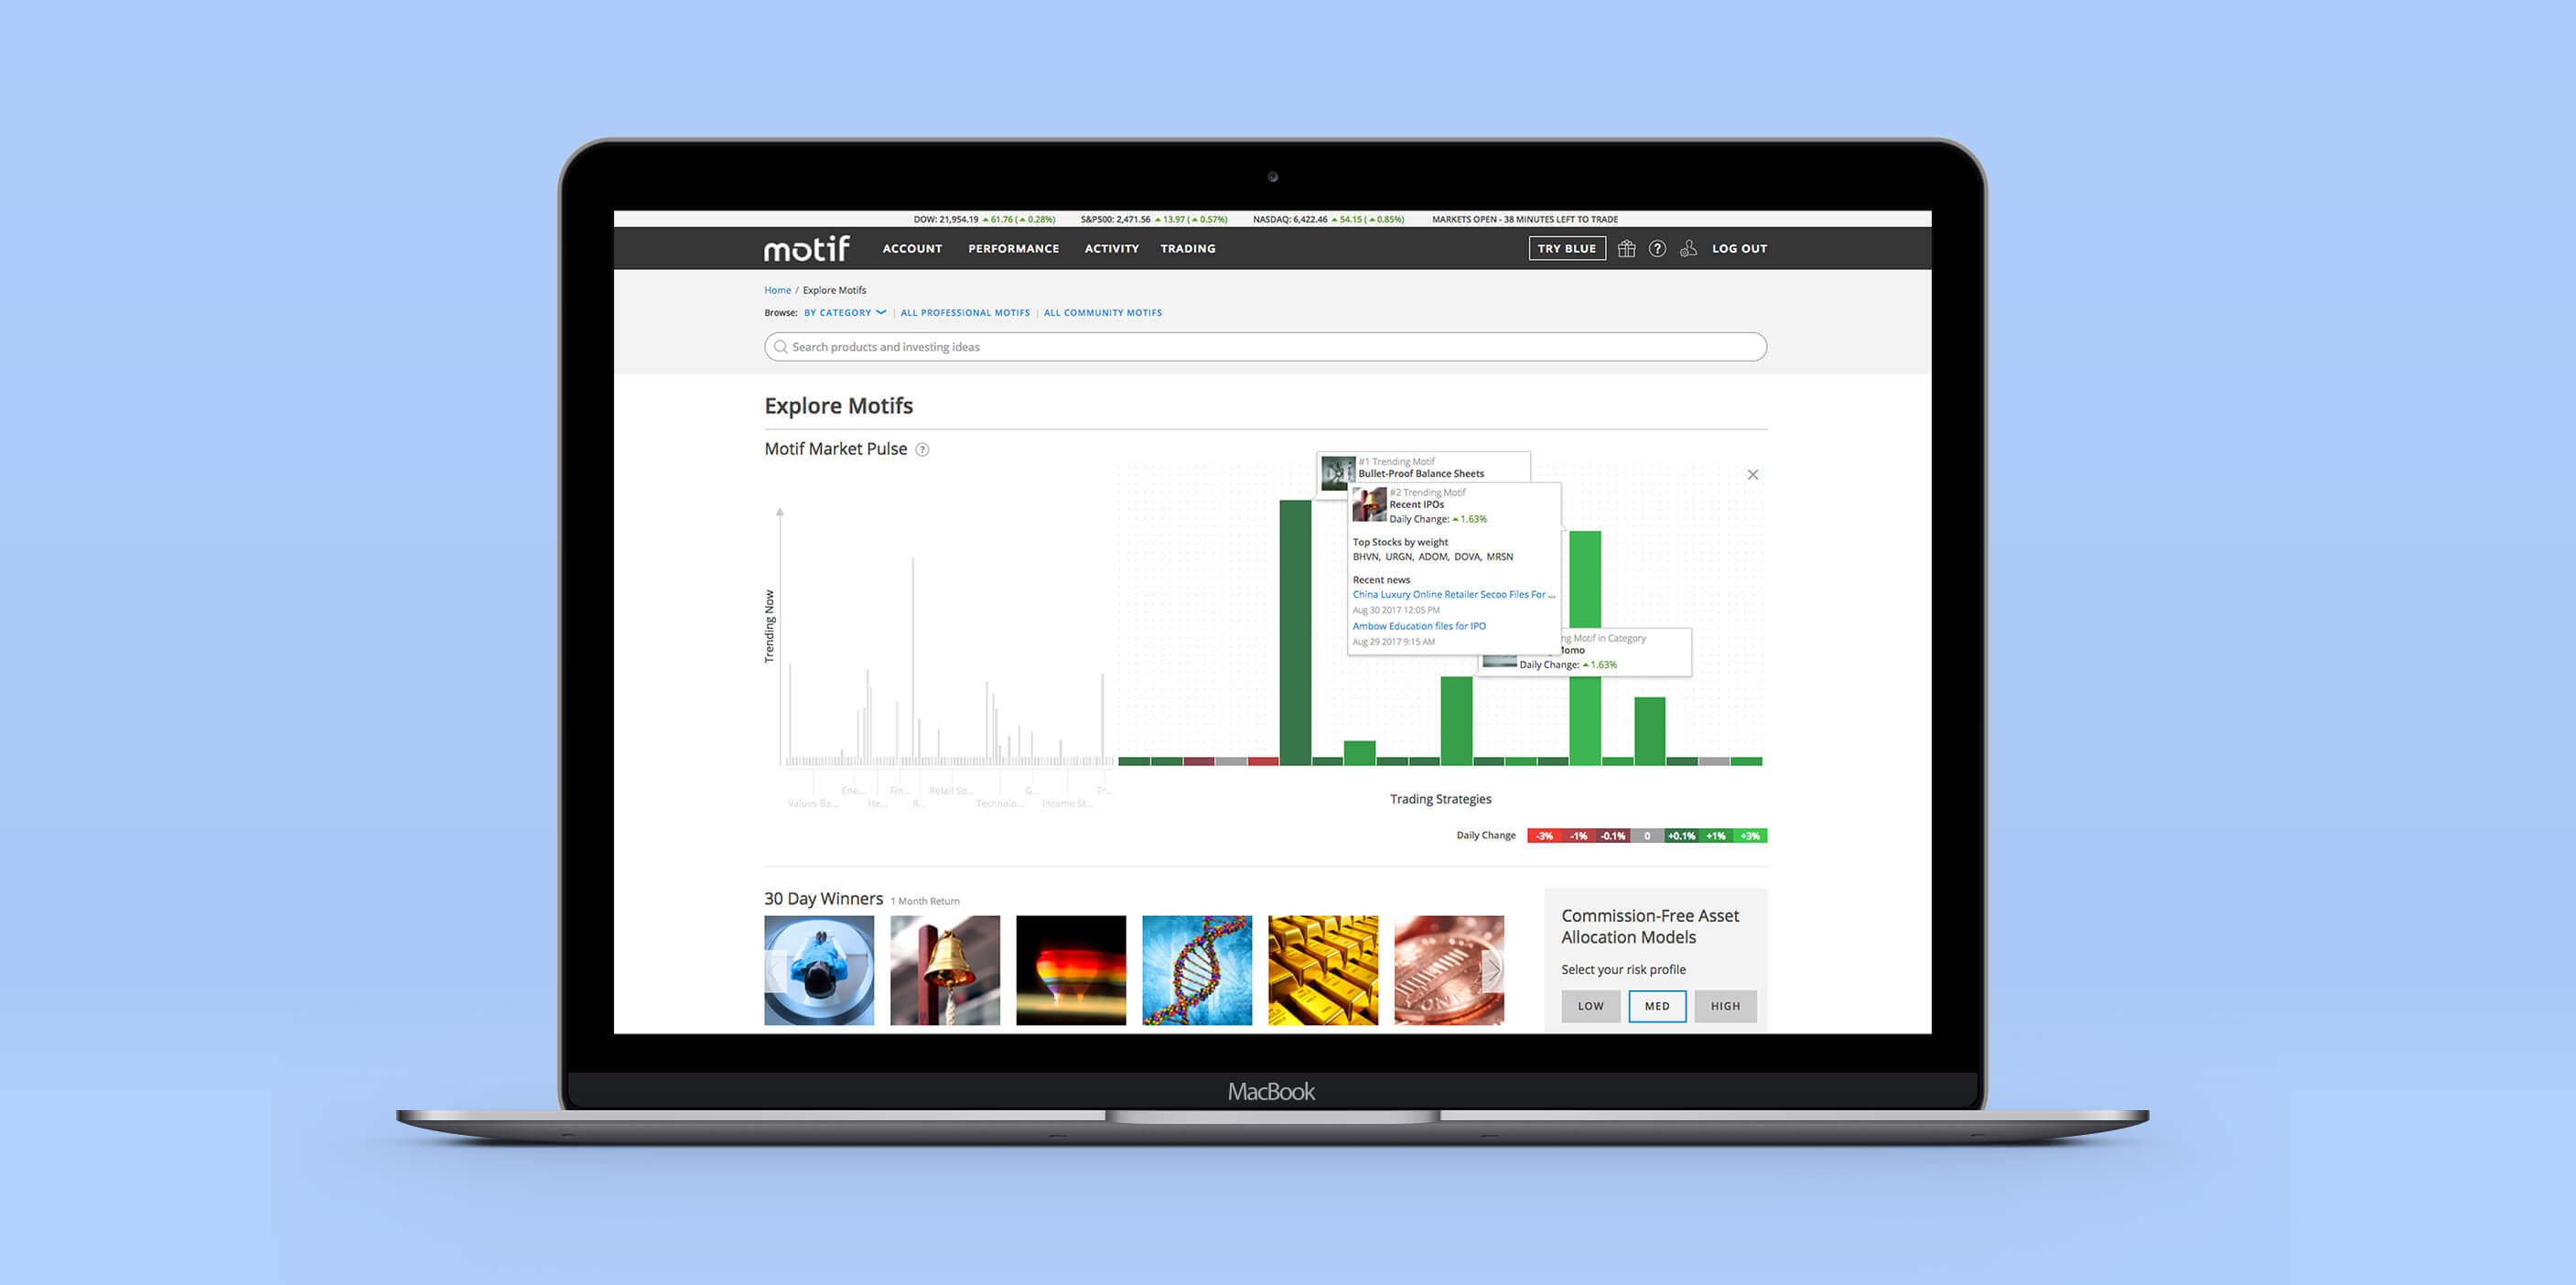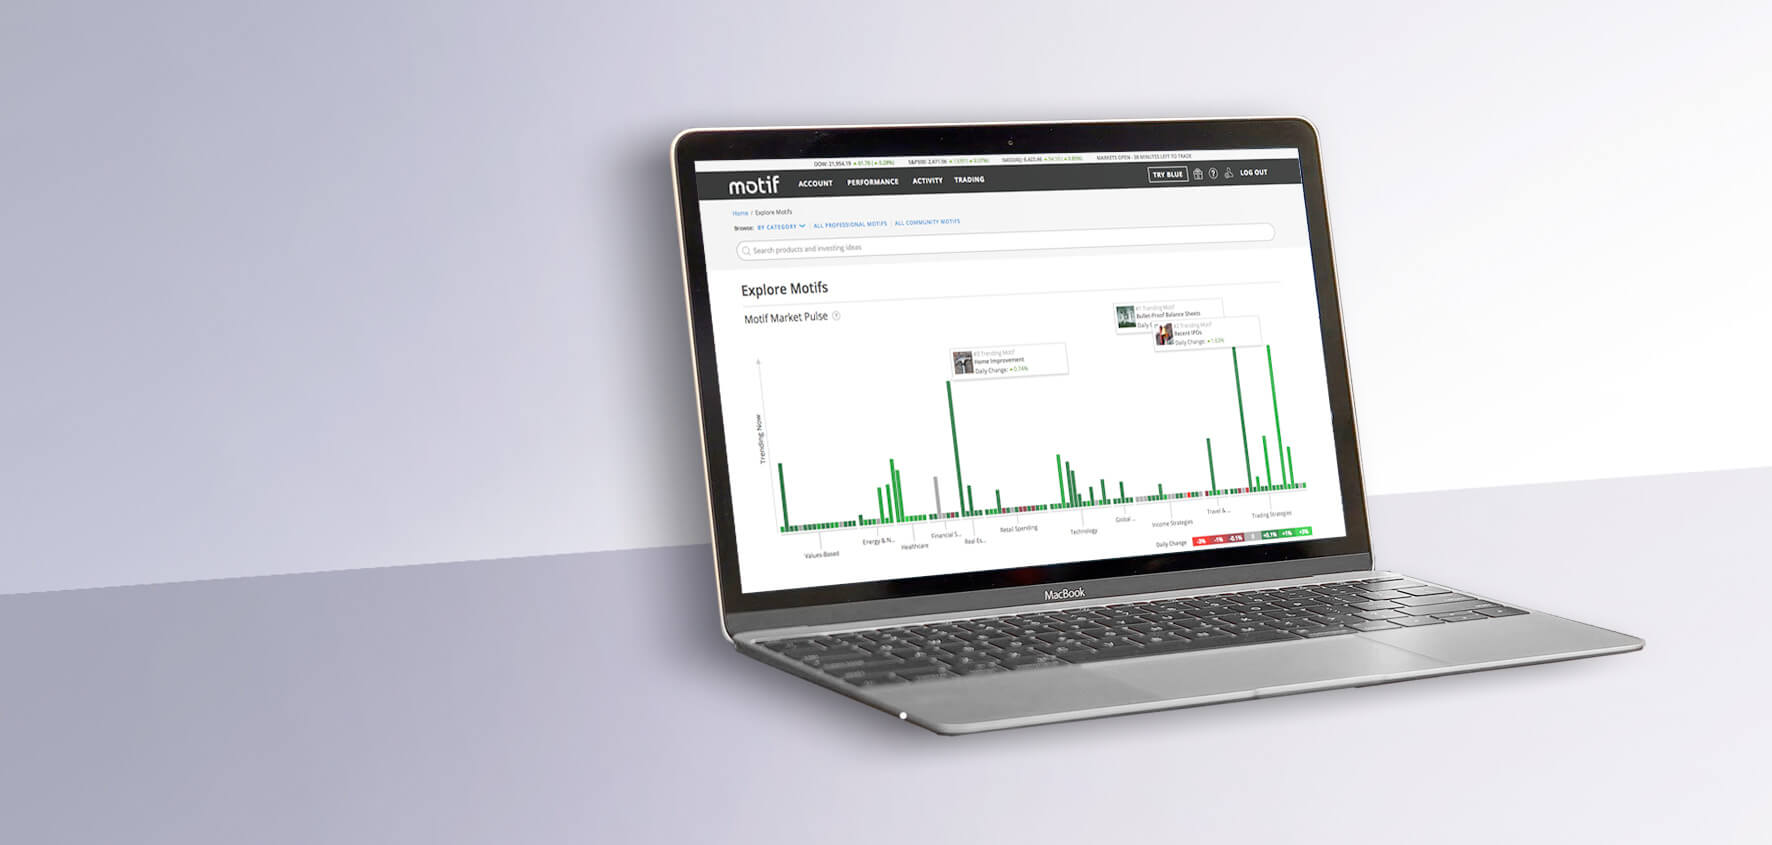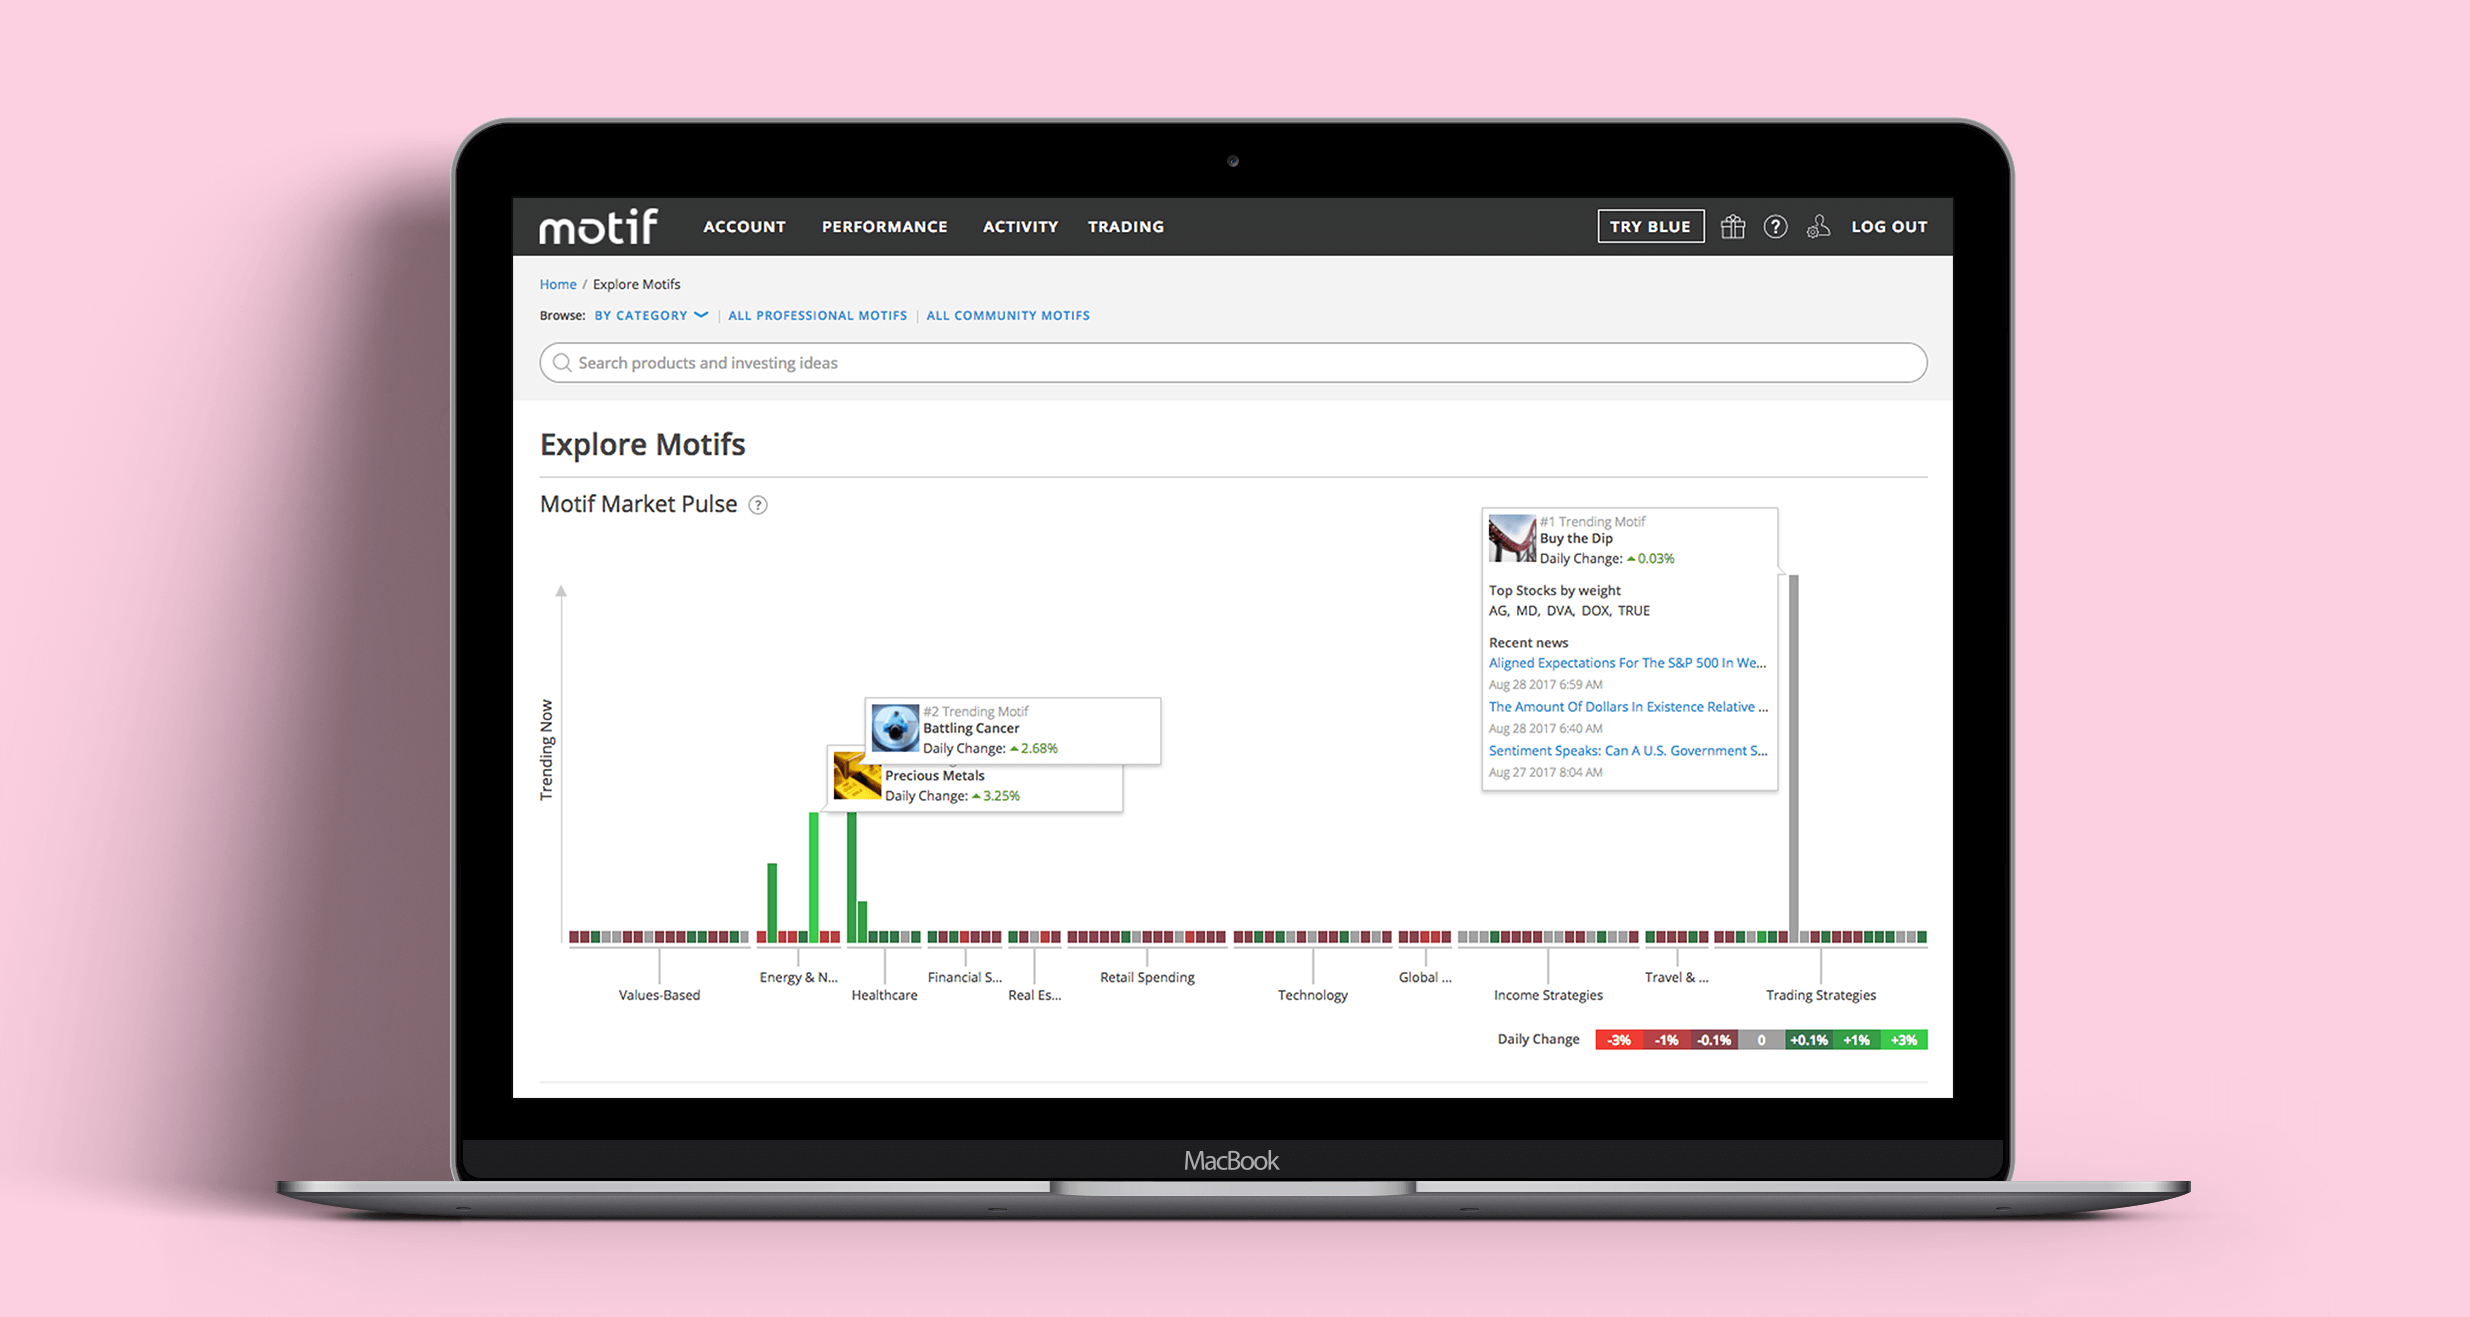
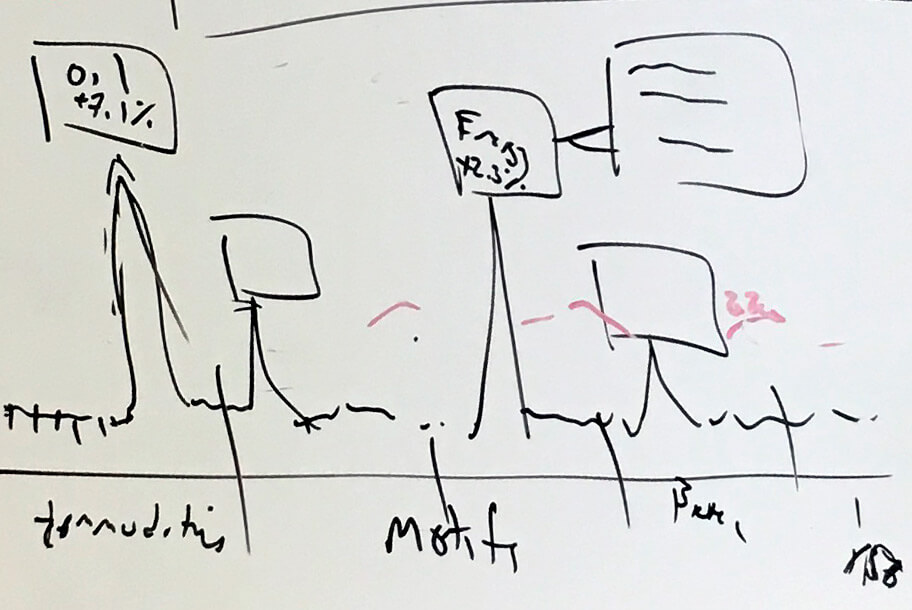
The brief was open-ended, so I explored a wide range of low-fidelity directions. Those early concepts gave the team something concrete to react to and helped us agree on what the visualization needed to communicate.
Even simple data visualizations could take effort to interpret. Getting ideas in front of users early helped us see which approaches made sense and which created more work than they were worth.
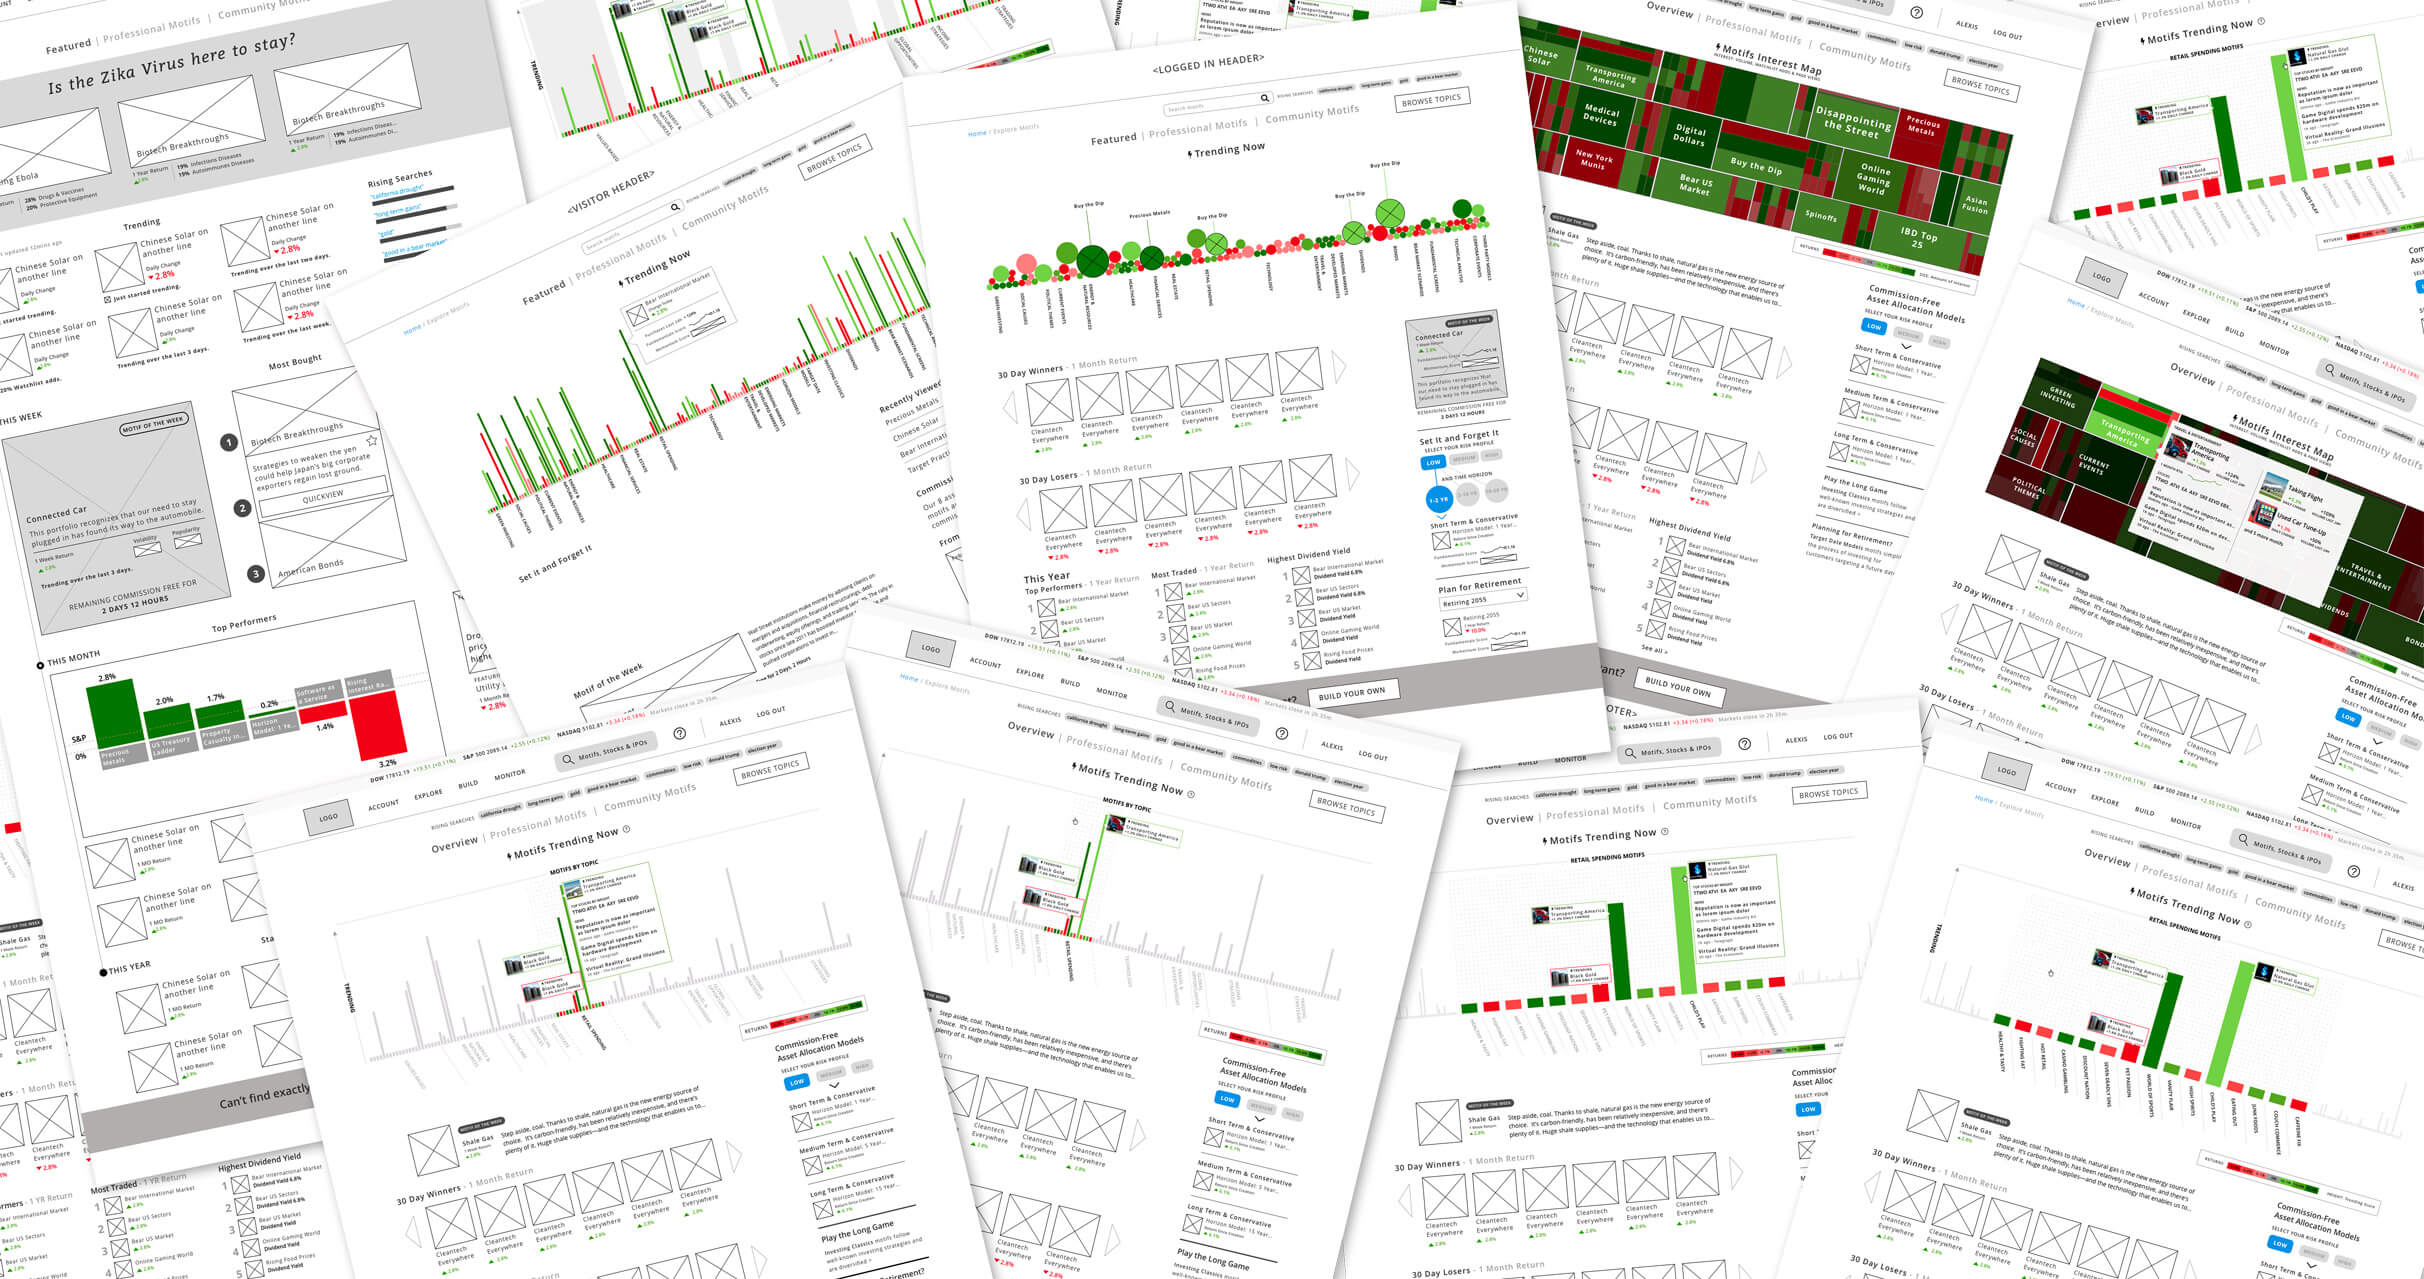
Two lessons stood out: test data visualizations with real people, and design them using real data. People weren't always willing to spend time deciphering a novel chart, so familiar conventions often helped.
I also learned the cost of working with placeholder numbers. Several concepts that looked promising in mockups became much less useful once actual data was applied.